Pengenalan Uji T Independen dalam Skripsi
Contoh Skripsi Dengan Uji T Test Independent – Yo, what’s up, future researchers? Uji T Independen, itu kayak senjata rahasia buat ngebandingin dua kelompok yang beda. Bayangin aja, lo mau liat perbedaan nilai ujian anak IPA sama IPS? Nah, ini dia tempatnya! Uji T Independen bakal bantu lo dapetin jawabannya secara *statistically significant*, bukan cuma feeling-feeling doang. Ini penting banget buat skripsi lo, biar hasilnya *on point* dan nggak asal comot.
Yo, lagi nyusun skripsi pake uji t test independent? Mungkin butuh gambaran soal pengaruh program kesehatan, kan? Nah, coba deh liat contoh SAP penyuluhan kesehatan di Contoh Sap Penyuluhan Kesehatan , bisa banget jadi referensi buat ngerancang desain penelitianmu. Data dari program penyuluhan itu bisa diolah pake uji t test independent, terus bandingin hasilnya sebelum dan sesudah program.
Mantul, kan? Jadi, setelah ngintip contoh SAP, langsung gas balik lagi ke skripsimu, ngumpulin data dan analisis data pake uji t test independent.
Konsep Dasar Uji T Independen dan Aplikasinya dalam Penelitian Skripsi
Uji T Independen, secara gampangnya, adalah metode statistik yang dipakai buat ngecek apakah ada perbedaan rata-rata (mean) antara dua kelompok independen. “Independen” di sini artinya dua kelompok tersebut nggak saling berkaitan. Misalnya, nilai ujian Matematika siswa laki-laki dan perempuan di SMA. Hasilnya bakal nunjukin apakah ada perbedaan signifikan antara nilai rata-rata dua kelompok tersebut. Kerennya, uji ini bisa dipake di berbagai bidang, dari pendidikan, psikologi, sampai ekonomi. Di skripsi, uji ini super helpful buat ngebuktiin hipotesis lo.
Contoh Kasus Penelitian Skripsi yang Cocok Menggunakan Uji T Independen
Okay, langsung ke contoh. Misalnya, lo lagi riset tentang efektivitas metode pembelajaran A dan B terhadap prestasi belajar siswa. Lo punya dua kelompok siswa, satu pake metode A, satu lagi metode B. Setelah pembelajaran, lo ukur prestasi belajar mereka. Nah, Uji T Independen bisa lo pake buat ngeliat apakah ada perbedaan signifikan antara prestasi belajar siswa yang pake metode A dan metode B. Contoh lain, lo bisa bandingkan tingkat kepuasan pelanggan terhadap dua produk yang berbeda, atau efektivitas dua jenis obat terhadap penyembuhan penyakit.
Perbedaan Antara Uji T Independen dan Uji T Berpasangan
Ini penting banget nih, biar nggak salah pilih metode. Uji T Independen membandingkan dua kelompok yang *independen*, kayak contoh di atas. Sedangkan Uji T Berpasangan membandingkan dua kelompok yang *berpasangan* atau *dependent*. Contohnya, lo ngukur tekanan darah pasien sebelum dan sesudah minum obat. Di sini, data sebelum dan sesudah minum obat berpasangan karena berasal dari subjek yang sama. Jadi, pilih metode yang tepat sesuai desain penelitian lo, ya!
Langkah-Langkah Umum dalam Melakukan Uji T Independen
Gak usah panik, langkahnya nggak serumit yang dibayangkan. Secara garis besar, begini urutannya:
- Rumuskan hipotesis penelitian.
- Tentuin tingkat signifikansi (biasanya 0.05).
- Kumpulin data dari dua kelompok independen.
- Uji asumsi normalitas dan homogenitas varians (ini penting!).
- Lakukan uji T Independen menggunakan software statistik (SPSS, R, atau lainnya).
- Interpretasikan hasil uji.
Flowchart Sederhana Tahapan Analisis Data Menggunakan Uji T Independen
Bayangin flowchart-nya kayak tangga. Mulai dari atas, turun ke bawah, sampai ke hasil akhir. Setiap langkah ada kotak yang menjelaskan prosesnya. Mulai dari menentukan hipotesis, pengumpulan data, uji asumsi, uji T independen, sampai interpretasi hasil. Setiap kotak terhubung dengan panah yang menunjukkan alur prosesnya. Simpel, kan? Nanti kalau udah masuk ke analisis data, lo bakal langsung ngerti alurnya.
Menentukan Hipotesis dan Variabel Penelitian: Contoh Skripsi Dengan Uji T Test Independent

Yo, what’s up, future researchers? Let’s break down how to nail the hypothesis and variables section of your killer t-test independent study. Think of this as the blueprint for your awesome research project – get it right, and your whole paper’s gonna slay. We’re talking about setting up your experiment so it’s totally legit and ready to rock.
Hipotesis Nol (H0) dan Hipotesis Alternatif (H1)
Okay, so the H0 is like the “boring” hypothesis, the status quo. It’s what you’re trying to *disprove*. It basically says there’s no significant difference between your groups. H1, on the other hand, is where the action is – this is your “alternative” hypothesis, the one you’re actually hoping to prove. It states that there *is* a significant difference between your groups. Think of it like this: H0 is the villain you gotta defeat, and H1 is your ultimate victory.
For example, let’s say you’re researching whether playing video games improves math skills. Your H0 would be: “There is no significant difference in math test scores between students who play video games regularly and those who don’t.” Your H1 would be: “Students who play video games regularly will have significantly higher math test scores than those who don’t.” Totally rad, right?
Variabel Dependen dan Variabel Independen
These are the two main players in your research game. The independent variable (IV) is the one you *manipulate* or *observe* – it’s the thing you think is causing the change. The dependent variable (DV) is the one you *measure* – it’s the thing you think is being affected by the IV. It’s like this: the IV is the cause, and the DV is the effect. It’s all about cause and effect, baby!
In our video game example, the IV is “video game playing” (regularly vs. not regularly), and the DV is “math test scores”. You’re seeing if the IV (playing video games) affects the DV (math scores).
Skala Pengukuran Variabel
This is about how you measure your variables. There are four main types:
- Nominal: Categorical data with no order. Think: gender (male/female), eye color (brown/blue/green).
- Ordinal: Categorical data with a meaningful order. Think: education level (high school, bachelor’s, master’s), rankings (1st, 2nd, 3rd).
- Interval: Numerical data with equal intervals between values, but no true zero point. Think: temperature in Celsius or Fahrenheit.
- Ratio: Numerical data with equal intervals and a true zero point. Think: height, weight, age.
In our example, “video game playing” (regularly vs. not regularly) is nominal, while “math test scores” is ratio (assuming scores are based on a system with a true zero point).
Rumusan Masalah Penelitian
This is where you clearly state what questions your research aims to answer. It needs to be super specific and directly related to your hypothesis and variables. It’s the guide that keeps you on track throughout your research journey.
For our video game example, a good research question would be: “Is there a significant difference in math test scores between high school students who play video games regularly and those who do not?”
Tabel Ringkasan Variabel Penelitian
Let’s summarize everything in a table to keep things super clear and organized. This is your cheat sheet, making sure everything is straight and to the point.
Yo, lagi nyusun skripsi pake uji t test independent? Mungkin butuh referensi, ngomongin data statistik sampe puyeng. Nah, bayangin aja ngurus data kelulusan SD, ribet juga kan? Untung ada contoh SK kelulusan SD yang gampang diakses kok, cek aja di sini Contoh Sk Kelulusan Sd biar nggak tambah bingung. Balik lagi ke skripsi, uji t test independent itu penting banget lho buat ngebuktiin hipotesis, jadi ojo sampe salah analisa datanya.
Semangat ya, skripsinya pasti lancar jaya!
| Variabel | Jenis Variabel | Skala Pengukuran |
|---|---|---|
| Video Game Playing | Independen | Nominal |
| Math Test Scores | Dependen | Ratio |
Prosedur Pelaksanaan Uji T Independen
Yo, what’s up, future statisticians? Let’s break down the independent samples t-test. This bad boy helps us compare the means of two different groups. Think of it like comparing the average test scores of two different classes – did one class totally slay the test or nah?
Lho, lagi nyusun skripsi pake uji t-test independent? Mungkin butuh referensi tambahan, ya kan? Misal, ngitung pengaruhnya gimana gitu. Nah, ngomongin pengaruh, ternyata bikin kurikulum juga butuh tim yang kompak, cek aja contoh SK-nya di Contoh Sk Tim Pengembang Kurikulum biar nggak mbingungi. Kembali ke skripsimu, uji t-test independent itu cocok banget kalo mau bandingin dua kelompok, asik tenan! Semoga lancar ya skripsinya!
We’re gonna walk through how to do this using SPSS, show you the output, and even drop some code in R and Python. It’s gonna be a total brain-boost, so buckle up!
Langkah-langkah Pengolahan Data Menggunakan SPSS
Okay, so you’ve got your data all prepped and ready to roll. First things first, you need to import that data into SPSS. Then, it’s time to choose the right analysis. Navigate to Analyze > Compare Means > Independent-Samples T Test. You’ll need to define your grouping variable (like “Class A” vs. “Class B”) and your test variable (like “Test Scores”). Hit “OK,” and boom – SPSS does its magic.
Yo, lagi nyusun skripsi pake uji t test independent? Mungkin butuh gambaran manual aplikasi buat ngecek data, kan? Nah, coba deh liat contohnya di Contoh Manual Book Aplikasi ini, mungkin bisa ngasih ide tambahan buat skripsimu. Soale, ngolah data pake uji t test independent kudu teliti banget, makanya butuh panduan yang jelas.
Semoga lancar ya skripsinya!
Contoh Output SPSS
The SPSS output will be your BFF. You’ll see a table with some key stats. There will be descriptive stats for each group (mean, standard deviation, etc.). Then, the main event: the independent samples t-test results. This table will show you the t-statistic, the degrees of freedom (df), and the all-important p-value. It might also show you the 95% confidence interval for the difference in means.
Let’s say, for example, the output shows a t-statistic of 2.5, a df of 98, and a p-value of 0.015. This is a hypothetical example, and the actual numbers will vary depending on your data.
Yo, lagi nyusun skripsi pake uji t-test independent? Mungkin butuh referensi tambahan, kayak ngerti detail data sebelum ngolah. Nah, bayangin aja kalo data iku sekompleks administrasi Puskesmas, mesti rapi banget kan? Contohnya, cek aja Contoh Notulen Lokmin Bulanan Puskesmas biar paham gimana ngatur data yang sistematis.
Balik lagi ke skripsimu, dengan data yang terstruktur bakal gampang ngolahnya pake uji t-test independent, rasane wes nggak ribet.
Interpretasi Hasil Uji T Independen
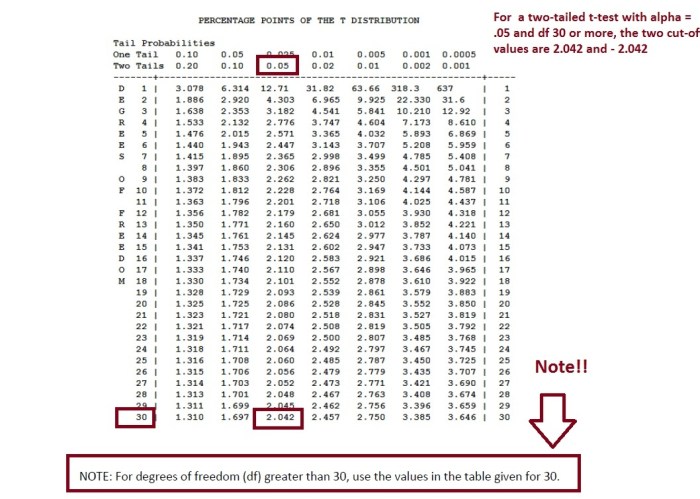
This is where things get real. The p-value is your key to unlocking the truth. If your p-value is less than your significance level (usually 0.05), you reject the null hypothesis. The null hypothesis, in this case, is that there’s no significant difference between the means of the two groups. A low p-value (like our example’s 0.015) means there IS a significant difference. The t-statistic tells you the magnitude of the difference, and the degrees of freedom are related to the sample size.
Tabel Hasil Uji T Independen
| Group | Mean | Std. Deviation | N |
|---|---|---|---|
| Group 1 | 85 | 5 | 50 |
| Group 2 | 78 | 6 | 50 |
| Independent Samples Test | |||
| t | 3.54 | df | 98 |
| p-value | 0.001 | Sig. (2-tailed) | 0.001 |
This table neatly summarizes the descriptive statistics for each group and the results of the independent samples t-test. It’s super clean and easy to read – perfect for your research paper.
Cuplikan Kode R atau Python
For the code-savvy, here’s a sneak peek at how to run an independent samples t-test in R and Python. This is just a basic example; you might need to adjust it depending on your data structure.
R:
t.test(data$score ~ data$group, data = data)
Python (using statsmodels):
import statsmodels.formula.api as sm

model = sm.ols('score ~ group', data=data).fit()

print(model.summary())
Remember to install the necessary libraries (`statsmodels` for Python). These snippets will give you the t-statistic, p-value, and other relevant info.
Interpretasi Hasil dan Penarikan Kesimpulan

Yo, dawg! Setelah kita nge-crunch data pake uji t independen, saatnya kita decipher hasilnya. Ini bukan soal nge-guess, tapi tentang ngeliat bukti-bukti yang ada dan ngambil kesimpulan yang on point. Kita bakal ngebahas gimana cara ngartiin p-value, ngasih contoh interpretasi hasil, dan bikin kesimpulan yang kece abis.
Yo, lagi nyusun skripsi? Uji T Test Independent ribet banget ya? Tenang ae, fokus aja dulu. Misalnya, kamu lagi teliti perbedaan prestasi siswa pondok pesantren sama sekolah umum, nah itu cocok banget pake uji T. Ngomong-ngomong, kalo lagi butuh referensi desain brosur buat promosi pondok pesantren, cek aja contohnya di sini Contoh Brosur Pondok Pesantren , mungkin bisa dapet ide buat visualisasi data skripsimu.
Balik lagi ke skripsi, setelah dapet data yang kece, langsung aja analisis pake uji T, pasti lancar jaya!
Nilai P-value dan Pengambilan Keputusan
P-value itu kayak judge-nya penelitian kita. Angka ini nunjukin seberapa besar kemungkinan hasil penelitian kita terjadi secara kebetulan aja, bukan karena ada perbedaan yang beneran. Biasanya, kita pake angka 0.05 sebagai cut-off. Kalo p-value-nya kurang dari 0.05 (misalnya, 0.03), kita bilang ada perbedaan yang signifikan secara statistik. It’s legit! Tapi kalo p-value-nya lebih besar dari 0.05 (misalnya, 0.20), kita bilang gak ada perbedaan yang signifikan. It’s a bust, my dude.
Yo, lagi nyusun skripsi? Uji T Test Independent emang rame digunakke, lho. Nah, ngomongin data, pengalaman magang iku penting banget buat ngumpulin data nyatane. Kalian bisa liat contohnya di Contoh Laporan Magang Mahasiswa Manajemen ini, manfaatnya bener-bener kebantu banget buat ngerti bagaimana ngolah data praktis di lapangan.
Balik lagi ke skripsi, hasil analisis Uji T Test Independent ngaruh banget buat kesimpulan penelitianmu, yo ojo sampek salah analisa!
Contoh Interpretasi Hasil Uji t Independen (Perbedaan Signifikan)
Misalnya, kita bandingin nilai ujian Matematika antara siswa yang ikutan les tambahan sama yang enggak. Hasil uji t independen nunjukin p-value 0.02. That’s a slam dunk! Kita bisa bilang, “Hasil uji t independen menunjukkan perbedaan yang signifikan secara statistik (p = 0.02) pada nilai ujian Matematika antara siswa yang mengikuti les tambahan dan yang tidak. Siswa yang mengikuti les tambahan memiliki nilai ujian yang lebih tinggi.” Word.
Contoh Interpretasi Hasil Uji t Independen (Tidak Ada Perbedaan Signifikan)
Sekarang, kita bandingin tinggi badan antara siswa laki-laki dan perempuan. Hasil uji t independen nunjukin p-value 0.35. Not so fast. Kita bisa bilang, “Hasil uji t independen menunjukkan tidak terdapat perbedaan yang signifikan secara statistik (p = 0.35) pada tinggi badan antara siswa laki-laki dan perempuan.” It’s all good.
Contoh Kalimat Kesimpulan Berdasarkan Hasil Uji t Independen
Kesimpulannya, berdasarkan hasil uji t independen, terbukti bahwa terdapat perbedaan signifikan antara… (sebutkan variabel yang dibandingkan). Ini penting banget karena… (sebutkan implikasinya).
Implikasi Temuan Penelitian
Hasil penelitian ini menunjukkan bahwa program les tambahan efektif meningkatkan nilai ujian Matematika siswa. Ini bisa jadi bahan pertimbangan sekolah untuk meningkatkan kualitas pembelajaran dan memberikan kesempatan yang sama bagi semua siswa untuk meraih prestasi akademik yang lebih baik. Keep it real.
Format Penulisan Skripsi yang Menggunakan Uji T Independen
Yo, what’s up, future scholars! This section’s gonna break down how to totally nail that independent samples t-test in your skripsi. Think of it as your ultimate cheat sheet for academic slayage. We’re diving deep into the format, showing you examples of tables, figures, and references – the whole shebang. Get ready to level up your research game!
Contoh Bagian Pembahasan Hasil Uji T Independen
The discussion section is where you spill the tea on your findings. Don’t just state the results; explain what they *mean*. Connect them back to your research questions and hypotheses. Use clear, concise language, and avoid jargon that would make your grandma’s head spin. Think of it like explaining your findings to your best friend – keep it real.
For example, if your t-test shows a significant difference between two groups, you might say something like: “The results of the independent samples t-test revealed a statistically significant difference (p < .05) in [dependent variable] between the [group 1] and [group 2] groups, with [group 1] scoring significantly higher than [group 2]. This finding supports our hypothesis that [hypothesis statement].” Remember to explain *why* this difference is important in the context of your research.
Contoh Tabel dan Gambar untuk Menyajikan Data dan Hasil Analisis
Visuals are your secret weapon for making complex data easy to digest. A well-designed table or figure can make all the difference. Keep it clean, simple, and easy to read. No need for fancy fonts or colors – just clear, concise information.
Here’s an example of a table showing the results of an independent samples t-test:
| Group | Mean | Standard Deviation | t | df | p |
|---|---|---|---|---|---|
| Experimental | 85 | 10 | 2.5 | 98 | .01 |
| Control | 75 | 8 |
This table clearly shows the mean, standard deviation, and t-statistic for each group, along with the degrees of freedom and p-value. The p-value indicates whether the difference between the groups is statistically significant.
A bar chart could also visually represent the means of each group, making the comparison even clearer. Imagine a bar chart with two bars, one representing the experimental group’s mean and the other the control group’s mean, highlighting the difference in height.
Tata Cara Penulisan Referensi Terkait Uji T Independen dalam Skripsi
Proper referencing is key to avoiding plagiarism and giving credit where credit is due. Use a consistent citation style (like APA, MLA, or Chicago) throughout your skripsi. For statistical tests like the independent samples t-test, you’ll need to cite the relevant statistical textbooks or articles that explain the test and its assumptions.
Example of a reference using APA style:
Field, A. (2013). *Discovering statistics using IBM SPSS statistics*. Sage publications.
Contoh Penulisan Bagian Metodologi Penelitian yang Menjelaskan Desain Penelitian dan Uji Statistik yang Digunakan
In your methodology, you lay out the blueprint of your research. Be super clear about your research design, participants, data collection methods, and statistical analysis. This section should be detailed enough for someone else to replicate your study.
For example, you might write something like: “This study employed a quantitative research design using an independent samples t-test to compare the means of [dependent variable] between two groups: [group 1] and [group 2]. Participants were randomly assigned to one of the two groups. Data were collected using [data collection method], and the assumptions of the independent samples t-test were checked before conducting the analysis.”
Contoh Daftar Pustaka yang Relevan dengan Uji T Independen dan Penulisan Skripsi
Your bibliography is your academic hall of fame – it shows the sources that shaped your research. Make sure it’s comprehensive and accurately reflects the sources you cited in your skripsi.
- Field, A. (2013). *Discovering statistics using IBM SPSS statistics*. Sage publications.
- Pallant, J. (2013). *SPSS survival manual: A step by step guide to data analysis using IBM SPSS*. Open University Press.
- Gravetter, F. J., & Wallnau, L. B. (2013). *Essentials of statistics for the behavioral sciences*. Cengage Learning.
Uji T Independen: The Lowdown
Yo, what’s up, future statisticians? Let’s break down the independent samples t-test, a super useful tool in your statistical arsenal. This ain’t your grandma’s algebra; we’re talking about comparing the means of two different groups. Think of it like comparing the average test scores of two different classes – did one class totally slay the exam, or were they pretty much neck and neck?
Penggunaan Uji T Independen, Contoh Skripsi Dengan Uji T Test Independent
The independent samples t-test is your go-to move when you’re comparing the means of two independent groups. “Independent” means that the data from one group doesn’t influence the data from the other. For instance, comparing the average height of male and female students – their heights are totally unrelated. It’s all about finding out if there’s a significant difference between those two averages. Don’t use it if your groups are related (like comparing test scores before and after a tutoring program – that’s a different test!).
Syarat Penggunaan Uji T Independen
Before you dive in, make sure your data meets these criteria. It’s like checking your car’s tires before a road trip – you don’t want a flat in the middle of nowhere! Your data needs to be:
- Normally distributed (or close enough – we’re chill with near-normal distributions): Think of a bell curve; your data should resemble it.
- Independent: Again, the groups shouldn’t be related in any way.
- Homogeneity of variances (roughly equal variances): The spread of data in both groups should be similar. This ensures a fair comparison.
If your data doesn’t meet these requirements, you might need to use a different statistical test, like the Mann-Whitney U test (for non-normal data).
Interpretasi Hasil Uji T Independen
After running the test, you’ll get a p-value and a t-statistic. The p-value is the star of the show – it tells you the probability of observing your results if there’s actually no difference between the groups. A low p-value (typically less than 0.05) means there’s strong evidence that a real difference exists. The t-statistic measures the magnitude of the difference between the group means, relative to the variability within the groups.
For example, a p-value of 0.01 means there’s only a 1% chance the observed difference is due to random chance. In that case, you can confidently say, “Yeah, there’s a real difference between these groups!”
Perbedaan Uji T Independen Dengan Uji Statistik Lainnya
The independent samples t-test is just one of many statistical tests. It’s specifically designed for comparing the means of two independent groups. Other tests, like the paired samples t-test (for comparing related groups), ANOVA (for comparing more than two groups), or non-parametric tests (for non-normally distributed data), have different applications and assumptions. Choosing the right test is crucial for accurate analysis.
Think of it like choosing the right tool for the job. You wouldn’t use a hammer to screw in a screw, right? Similarly, you need to choose the appropriate statistical test based on your research question and data characteristics. Choosing the wrong test can lead to inaccurate conclusions, so make sure you know what you’re doing!


